Tables, graphs and charts
Pictograms
Learn how to use and interpret pictograms, charts that use pictures or symbols to represent data.

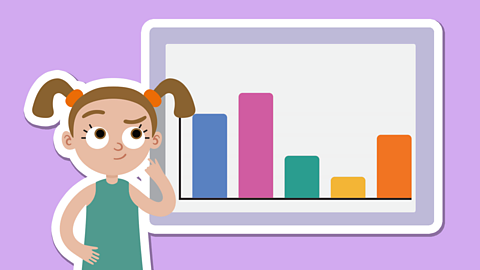
Bar charts
Learn how to read and interpret bar charts.
Comparing data
Learn about some different ways to visualise and compare data.
Interpreting timetables
Find out how to read timetables and answer questions about them.

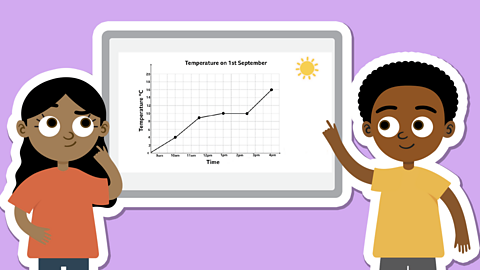
Line graphs
Explore line graphs and how to draw them.
Pie charts
Learn about pie charts and how to analyse them.

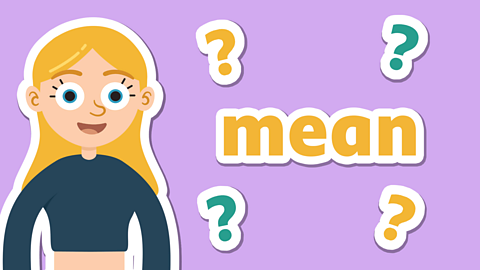
Calculating the mean
Find out how to work out an average by finding the mean.
Links
- External linkExternal link
- SubscriptionSubscription
- External linkExternal link
- External linkExternal link
- SubscriptionSubscription
- External linkExternal link
- SubscriptionSubscription