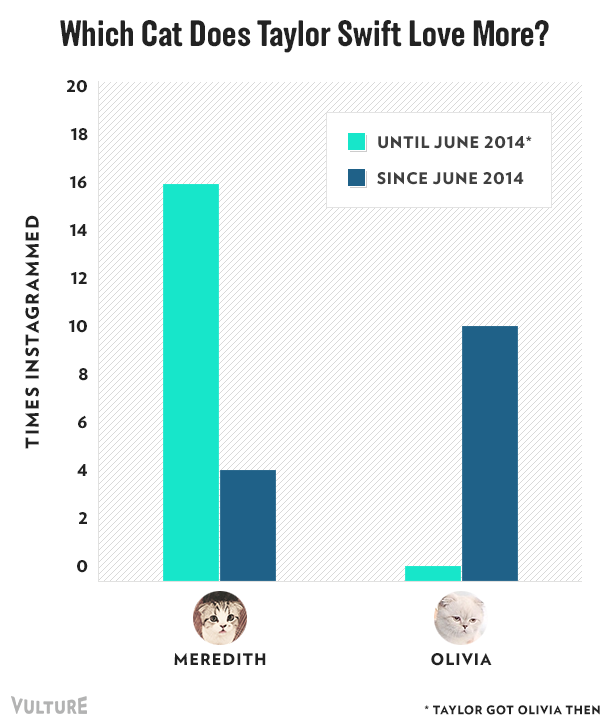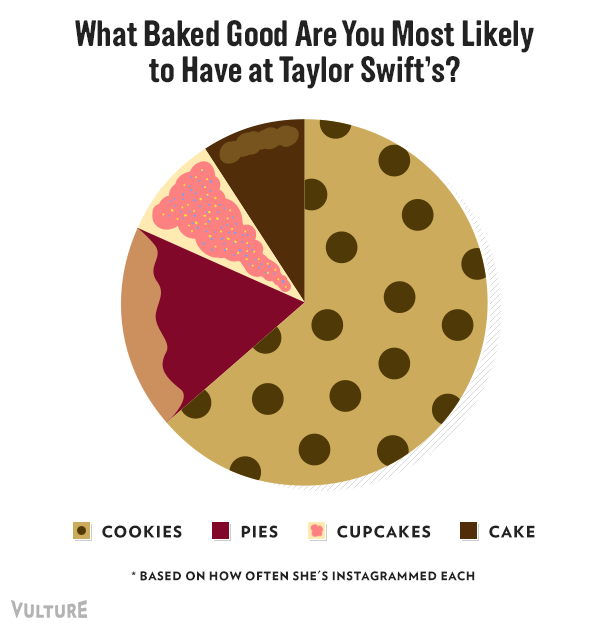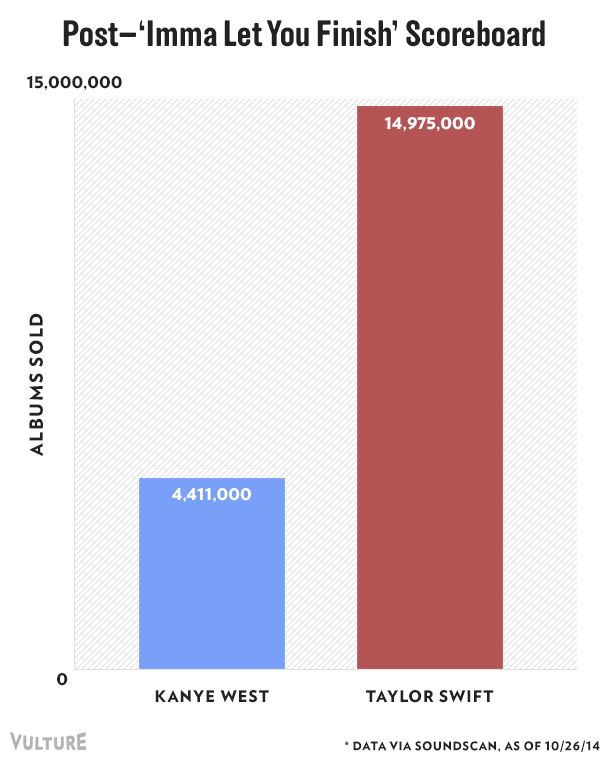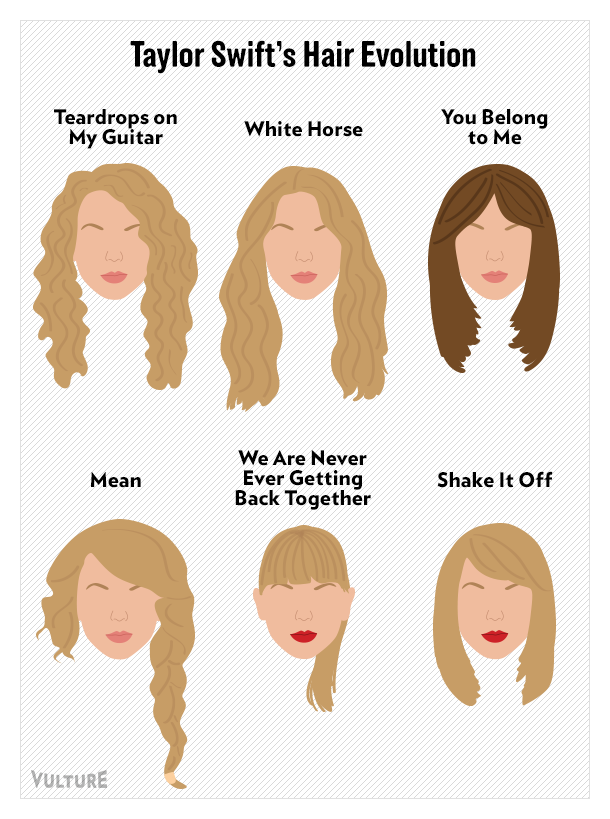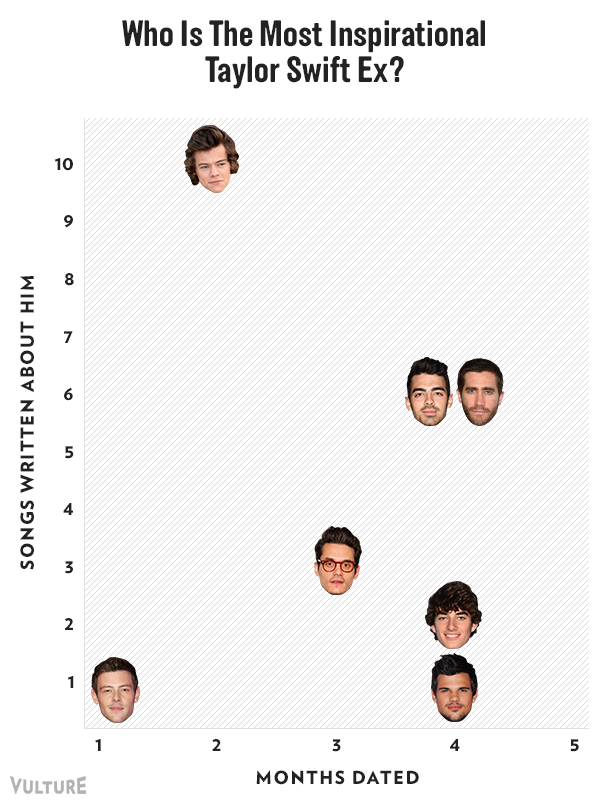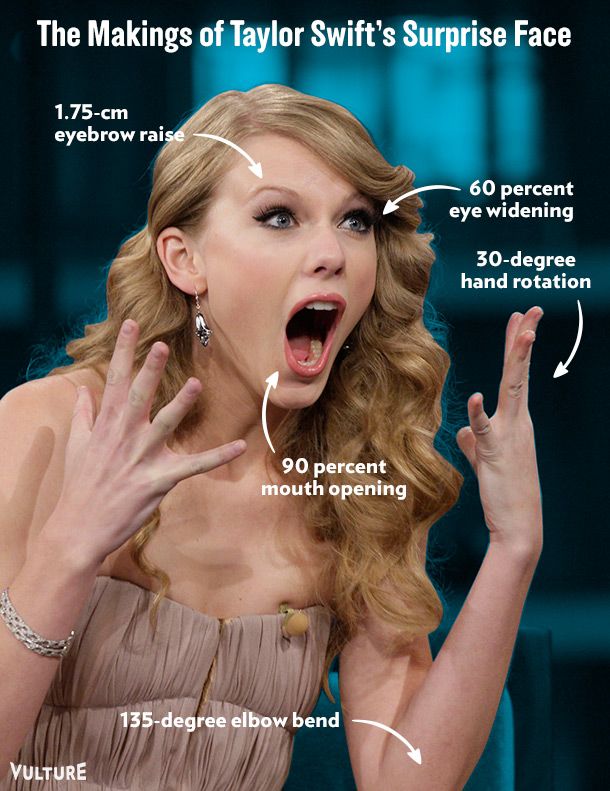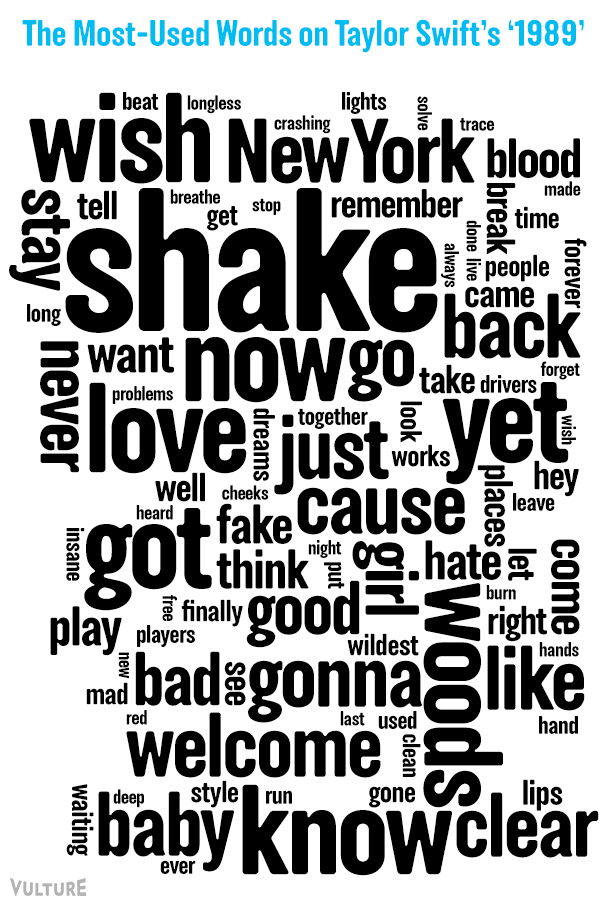
With Taylor Swift’s much-anticipated 1989 out this week, we’ve looked at it from many, many angles — critically, historically, emojically — but now it’s time to analyze the cold, hard data. Well, less cold, hard data and more warm, soft data — like a cookie! Here are seven graphs and charts that look at the most important statistics about Swift’s career, from album sales since Kanye “let [her] finish” to which cat she loves more to all of her haircuts to, yes, cookies. Charters gonna chart-chart-chart-chart-chart and graphers gonna graph-graph-graph-graph-graph.


