Most Saturday Night Live viewers have no doubt experienced Repetitive-Sketch Syndrome — that uncanny feeling that you’re watching a character or setup you’ve seen a zillion times before. As each new season unfolds, the sense of déjà vu progresses from being shruggingly tolerable to moderately irksome, until you reach that moment when, after yet another cast member debuts her Barbara Walters impression or tries out that anal-retentive talk show host, you absolutely must tweet four growled words: Least. Original. Season. Ever. But is it really? Or is it just a symptom of the now 36-year-old phenomenon of always thinking that things used to be better on Saturday Night Live?
It is time to cast off recurring-character intuition and turn to cold, hard science. In a research project that has taken over a year to tabulate, Vulture has determined an Originality Quotient for every complete season so far of Saturday Night Live; this number determines what percentage of a season’s sketches and bits involved characters or setups seen for the first (or only) time, as opposed to the return of a favorite character, be it the Bees, Hans and Franz, Mary Katherine Gallagher, Brian Fellow, or Stefon. The broad strokes of our methodology in calculating an Originality Quotient are as follows: We counted every sketch in a season (including guest commentaries on “Weekend Update”), subtracted the number of sketches that involved a recurring character, then divided the remaining number by the season’s total number of sketches. In the life of SNL, we discovered many outliers that aren’t easily defined as “sketches” or “characters” (Andy Kaufman bits? Political impressions? Multiple Buckwheat appearances in one show?) and designed logical rules for each: Our complete methodology will appear on Vulture soon.
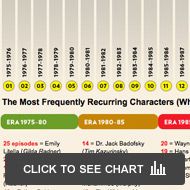
With every season’s repetition or lack thereof calculated, surprises emerge. Is there an ideal balance of fresh ideas and catchphrase-spouting favorites? Are hugely repetitive seasons necessarily creative low points? Or might recurring sketches be an indication that things are humming along nicely? The answers lie somewhere among the 7,798 sketches and 702 “Weekend Updates” we just tirelessly dissected, so enlarge the above graph (or print out the PDF version that appears in this week’s New York Magazine here), and roll over each season to get its Originality Quotient and to read analyses of key years that illuminate the power or problems of originality or the lack thereof. (Additional reporting by Matthew Kitchen, Cooper Marshall, Brian Raftery, Alexa Tsoulis-Reay, and Emily Watkins)
Related: Who are the top 20 most repeated characters in Saturday Night Live history?
Also, for a printable PDF version of this chart that appears in New York magazine’s Vulture pages this week, click here.


